
The Breakout Probability Matrix: How Math Saved My Trading Account

Hey there,
Let me tell you about the MYO breakout that taught me a nice lesson. I entered this trade watching a medical device stock that, at first glance, looked like a textbook play. I saw the price pushing through a clear resistance level, and I went in with high expectations.
The breakout happened just as I’d hoped. Price pushed through the local high, and for a moment, the trade was firmly in the green. But then…. the market rejected the move hard.
As you can see in the data below, the reversal was swift. By the time I cut the position, I was staring at a significant drawdown.
The Reality of the MYO Trade
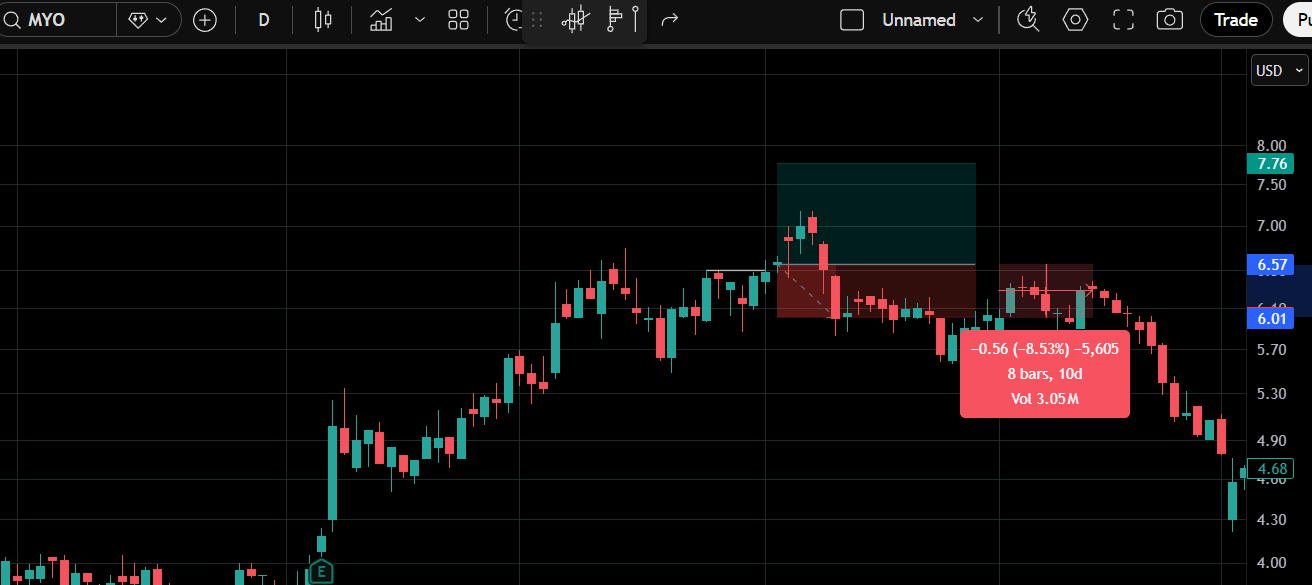
Looking back at the specific metrics of that exit, the numbers don’t lie..:
Point Price Drop -0.56 (-8.53%)
Duration 8 bars (10 days)
That single trade was a wake-up call. It taught me something crucial: breakouts aren’t about being “right” they’re about surviving when you’re wrong. Even when a chart looks promising, the market doesn’t care about your conviction.
The Matrix: Breaking Down Breakout Quality
Today, I use what I call the “Breakout Probability Matrix.” Instead of relying my early hour feelings, I score every potential breakout across five factors to determine its quality.
One of the most important factors is the Catalyst Presence. I no longer trade “hopes”. For MYO, while the price action was volatile, the underlying financial data provided the real context.
Financial Context: MYO Earnings & Revenue
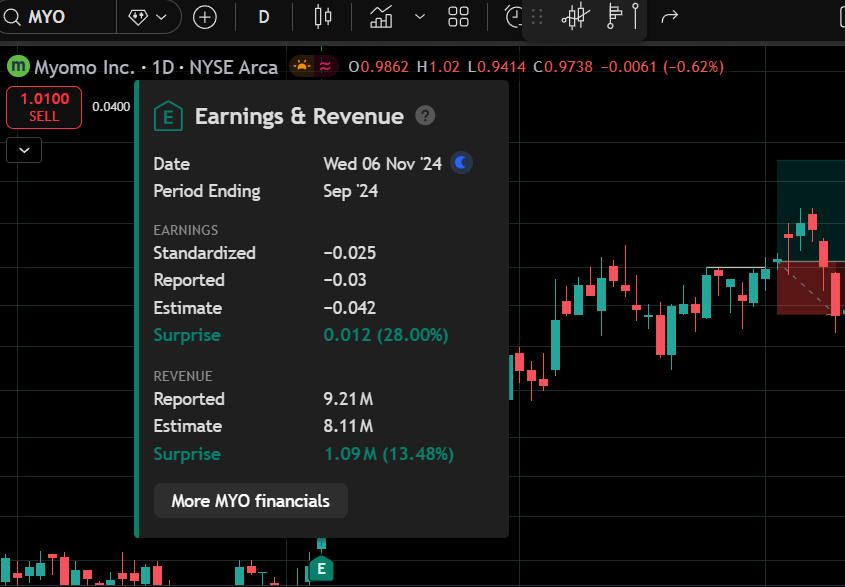
A breakout is far more likely to sustain if it’s backed by a “surprise” in the fundamentals. Here is how the numbers looked for the period ending September ‘24:
Earnings Surprise: +0.012 (28.00%)
Revenue Surprise: +1.09M (13.48%)
Reported Revenue: 9.21M vs. 8.11M Estimate
While these numbers were positive, the “Matrix” forces me to look at how the price reacts after the news. In the case of MYO, the positive surprise wasn’t enough to maintain the momentum, leading to the failed breakout signal.
The Math: Position Sizing That Actually Works
The key insight of the Matrix is that your position size should reflect the actual probability of success. I use a specific formula to ensure I never risk more than 1% of my account on any single trade:
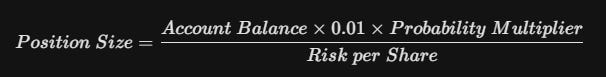
Where the Probability Multiplier is simply the Matrix Score divided by 100.
In the MYO trade, the chart showed a clear “buy” arrow followed shortly by a “sell” signal. Under my old system, I would have been “all-in.” Under the Matrix, a setup that shows signs of rejection (like the red arrow and blue circle in my analysis) would have triggered a much smaller position or an immediate exit.
Why This Works When Everything Else Fails
WallStreetBest traders think risk management just means “having a stop loss.” The Matrix goes deeper it forces you to think in probabilities.
When a setup hits my stop, I don’t beat myself up. If the math says a certain setup fails 25% of the time, that loss is just a cost of doing business. This change in perspective has completely transformed my psychology. I no longer chase “sure things”; I manage a portfolio of high-probability bets.
If you’re still sizing positions based on “how it feels,” you’re gambling. The market cares about probabilities, not your feelings.
Go look at your last breakout trade. Run it through the Matrix. What score would it get?
Stay mathematical,
Roman Blackwood